Is Your Loyalty Program Healthy?


What to Track to Assess Loyalty Program Health
Modern loyalty dashboards go far beyond signups and redemptions.
The following categories represent the backbone metrics every 2026-ready program must monitor:
1. Member Health Overview
Active Membership Rate: Percentage of enrolled members earning or redeeming in the last 90 days. Best-in-class programs maintain 60–85% activity rates.
Churn & Dormancy: Track rolling churn and dormant accounts by cohort, with drill-downs for high-value segments.
2. Engagement & Experience
Redemption Rate: Share of members redeeming points/benefits within a defined window (typically 15–30% for strong programs).
Multi-Channel Engagement: Breakdown of digital, app, in-store, and social interactions.
NPS & CSAT Tracking: Quarterly scores for both loyalty-specific and brand-level customer experience. NPS increases of 12–22 points are reported among loyalty members in top programs.
Campaign/Offer Response Rates: Real-time measurement of targeted offer performance, A/B tests, and personalized engagement.
3. Financial & Value Analytics
Average Spend per Member: Trends for loyalty participants versus non-members, highlighting incremental lift.
Customer Lifetime Value (LTV): Current LTV by cohort, channel, and tier programs with real-time LTV optimization report 20–30% higher returns.
ROI Dashboard: All-in calculation of program costs vs. direct and attributed revenue, segmented by feature and member type.
4. Segmentation & Personalization
Micro-segment Health: Visualize performance by age, region, status tier, and behavioral cohort to spot growth opportunities.
Personalization Index: Share of interactions/offers personalized per member, with correlation to engagement and spend.
5. Risk, Compliance & Operational Health
Fraud & Compliance Detection: Real-time fraud risk scores and regulatory requirements met per market.
Data Quality & System Uptime: Ongoing monitoring of integration errors, downtime, and data completeness.
Best Practices While Designing Loyalty Dashboards
- Clarity and Customization: Ensure executives, managers, and analysts have personalized views, high-level summaries for leaders, granular breakdowns for practitioners.
- Mobile Accessibility: Dashboards built for both desktop and mobile keep teams informed on-the-go, supporting rapid intervention.
- Drill-Down Functionality: Allow users to move from top-line metrics into transaction-level detail or member journey maps.
- Real-Time Alerts: Immediate notifications for metric deviations, e.g., sudden drop in engagement, breaking regulatory thresholds, or spikes in fraud risk.
- Trend Visualizations: Use charts and heat maps for month-over-month, season-over-season analysis to separate noise from meaningful shifts.
Common Challenges & How to Overcome Them
- Data Integration Silos: Invest in ETL tools and platform modernization to achieve one holistic view.
- Lagging Insights: Move from monthly to daily data refresh cycles to act before issues compound.
- Stakeholder Alignment: Train non-technical program owners to interpret dashboards and take timely action.
- Overwhelming Complexity: Focus dashboards on actionable KPIs and storytelling, minimizing vanity metrics.
By 2026, loyalty health assessment dashboards will serve not only as reporting tools, but as command centers. They will be driving predictive engagement, risk mitigation, and instant value optimization. Brands that master dashboard design and usage will outperform, sustaining loyalty growth even as programs and markets evolve.
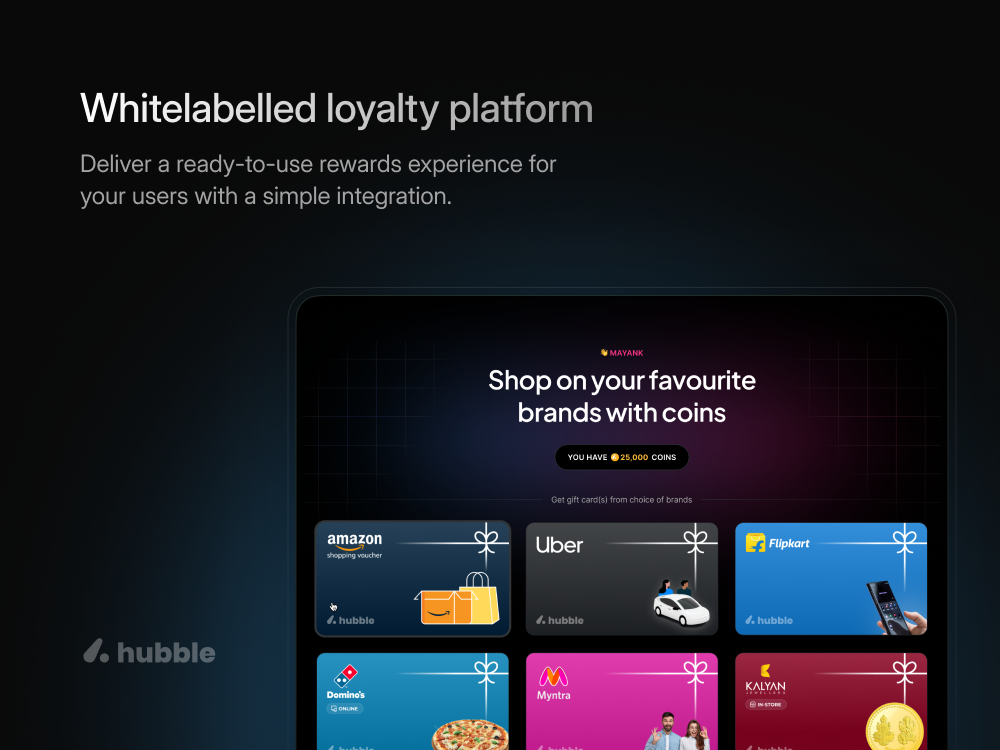
When you’re ready to bring clarity, agility, and measurement rigor to your loyalty strategy,
Hubble’s platform delivers real-time, customizable dashboards and AI-powered analytics tailored for every role. Unlock decision-ready insights and confident optimization, backed by the expertise and infrastructure trusted by leading global brands.
Short summary